Anthropic uses Claude Science to estimate the missing third of the UV sky
Astrophysicist Brice Menard guided agents through decades of telescope data; about one-third of the finished map is inferred rather than directly observed.
By Ryan Merket · Published
Primary source: X
Why it matters
Claude Science coordinated a multi-stage astronomy data workflow, but one-third of the map is inferred, and a human researcher caught an artifact that agent reviews missed.
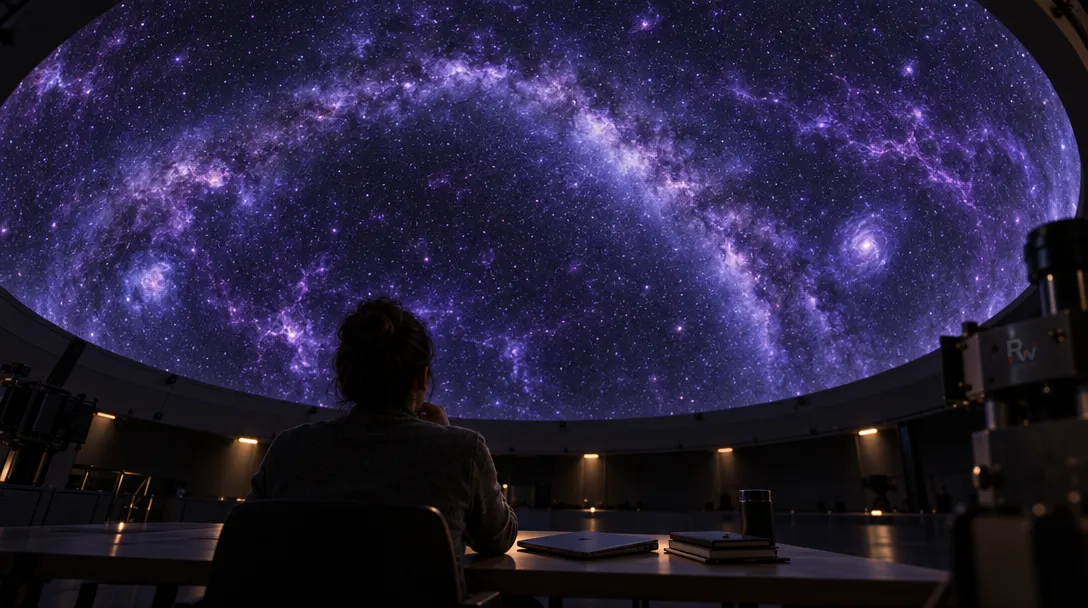
Anthropic says Claude Science helped astrophysicist Brice Menard assemble the first complete ultraviolet map of the sky, including estimates for roughly one-third of the area that no ultraviolet telescope has observed. Menard described the work in an Anthropic research post published October 8th, 2026, after the project took several days over the summer.
Menard is a Johns Hopkins University professor whose research spans astrophysics, statistics and machine learning. He set the scientific task and guided the process. Anthropic says Claude coordinated agents that gathered and processed the data. The system handled an extended chain of data work, while Menard chose the goal and inspected the output.
Astronomers have incomplete sky maps because ultraviolet light is absorbed by Earth's ozone layer, so they need space telescopes to observe it. NASA's GALEX mission, which operated from 2003 to 2013, produced the largest dataset, covering about two-thirds of the sky across roughly 38,000 observations. It avoided regions around very bright stars, including much of the Milky Way's plane, to protect its detectors. Data from other missions added coverage but left gaps.
Claude's agents searched for public surveys, downloaded observations, made them comparable across instruments, removed glare around bright stars and aligned the surveys on a shared coordinate system. The resulting map combines far-ultraviolet light at 154 nanometers with near-ultraviolet light at 232 nanometers. For missing regions, Claude used a method called inpainting and correlations between ultraviolet measurements and observations in visible, infrared and radio wavelengths. The map also incorporates ultraviolet estimates for more than 100 million stars, inferred from visible-light measurements by the European Space Agency's Gaia mission.

The missing third is modeled, not measured. To test that part of the work, Menard says he asked Claude to hide regions with known ultraviolet data and predict them. After refinement, its estimates were within about 10% of the withheld measurements. The test shows performance in selected known regions; it does not establish that predictions in unobserved parts of the sky are equally accurate. The finished map distinguishes measured and predicted pixels and includes uncertainty estimates.

Menard spotted faint circular patterns in a dim area of an early map. They were traces of individual GALEX observations, caused by uneven ultraviolet glow from Earth's atmosphere. Anthropic says two rounds of review by other agents had missed the artifact. After Menard pointed it out, Claude traced the issue and corrected the atmospheric glow across all 38,000 GALEX observations.
Menard says the project took several days, while comparable work would take people weeks. Agents ran searches and computations for hours while he worked on other projects. Menard still had to notice a flaw, direct a correction and judge what the estimates meant.
Anthropic introduced Claude Science in beta on June 30th, 2026, describing it as a research workbench that coordinates agents, connects to scientific tools and keeps a record of how outputs were produced. This project applies that approach beyond the biology-heavy examples in the launch announcement, to astronomy's data-cleaning and calibration work. Anthropic presents the map primarily as an educational resource, giving students a view of structures in the Milky Way that had been difficult to show with incomplete ultraviolet coverage.
Anthropic presents the map as a visualization of existing data, not a new telescope observation or a substitute for ultraviolet measurements. Its predicted regions are labeled, so users can distinguish measured data from estimates.