Cloudflare adds production flamegraphs to Workers, exposing where CPU and memory go
The on-demand profiles cover Workers and Durable Objects; Cloudflare's examples show what brief, traffic-dependent captures can reveal and what they miss.
By RuntimeWire Staff · Published
Primary source: The Cloudflare Blog
Why it matters
Cloudflare is giving Workers developers code-level visibility into production CPU use and allocations, but captures still depend on live traffic and do not reveal retained memory or rare events outside the profiling window.
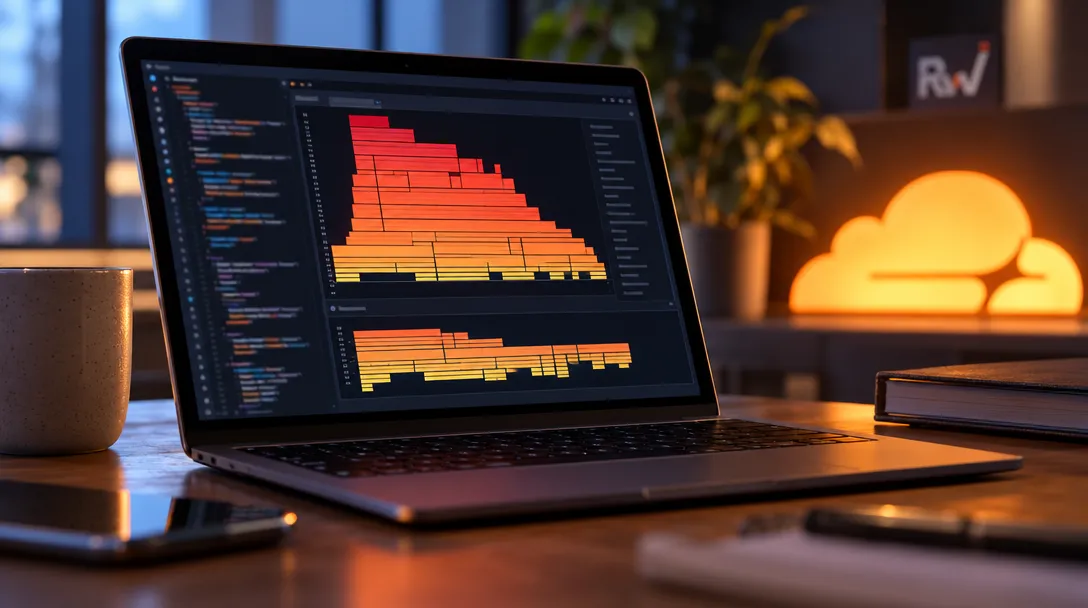
Cloudflare added on-demand CPU and allocation profiling for Workers and Durable Objects, giving developers a way to inspect code running in production instead of relying only on logs and aggregate metrics. The feature, described in an October 9th post on the Cloudflare Blog, renders profiles as interactive flamegraphs in the dashboard and lets users download them for analysis with other tools.
The post is by Dominik Picheta, a Cloudflare software engineer who previously worked at Meta. Picheta is also the author of Nim in Action and a contributor to the Nim programming language.
In a serverless environment, reproducing production traffic locally can be difficult. Developers can choose a Worker version and capture duration, then inspect the flamegraph or download a pprof profile. Cloudflare's production profiling documentation lists capture durations from one to 50 seconds and also documents profiling a specific Durable Object instance through the dashboard, CLI or API.

A profile can find waste hidden in ordinary code
Cloudflare's clearest CPU example comes from the Worker behind its R2 object-storage binding. In a 50-second capture, the genericR2JsonReplacer function accounted for more than 5% of CPU time. The team found that JSON serialization was already walking a tree while the replacer walked it again, repeating work on nested values. Cloudflare says removing that duplicate traversal made the function 2.7 times faster.
A second finding involved a duplicate call to a metrics function, which accounted for about 1% of CPU time in the profile. Reusing the first result removed the extra work. The figures come from Cloudflare's own example, not an independent benchmark. The profile showed the team where familiar code paths were doing unnecessary work.
The memory example connects profiling to a harder operational problem. Cloudflare says an internal Worker was frequently evicted after its P999 memory usage reached about 133 MB, above the 128 MB limit. A heap profile showed that Prometheus instrumentation, which the team believed was disabled, still accounted for roughly 66.7% of allocations in the capture. After the code path was removed, Cloudflare reported P999 memory falling to 118 MB, leaving about 10 MB of headroom.
RuntimeWire has previously covered Cloudflare's Python support in Workers and an internal memory optimization in Pingora.
Production access comes with constraints
The capture is on demand, not continuous. A Worker or Durable Object must already be active and receiving traffic during the selected window; profiling does not generate requests or start a fresh isolate. Developers need the relevant code to run while the profiler is collecting data. Cloudflare says profiling requests are also rate limited, and availability can vary by environment.
Memory profiling samples allocations made during the capture window. It is not a heap snapshot and does not show which objects remain in memory. A short profile can help locate allocation-heavy code, but it cannot by itself establish that a function is retaining memory or explain allocations that happened outside the capture.
Cloudflare's post also says TypeScript projects should enable source maps so profiles show useful function names. Without them, minified or obfuscated names can make a flamegraph much less actionable. Developers need to select an active version with suitable traffic, exercise the code path, and make sure the build preserves source-level mappings.
Cloudflare says it is working on continuous profiling to make intermittent problems easier to catch. Continuous profiling could catch a rare spike that ends before an engineer starts a manual capture.